

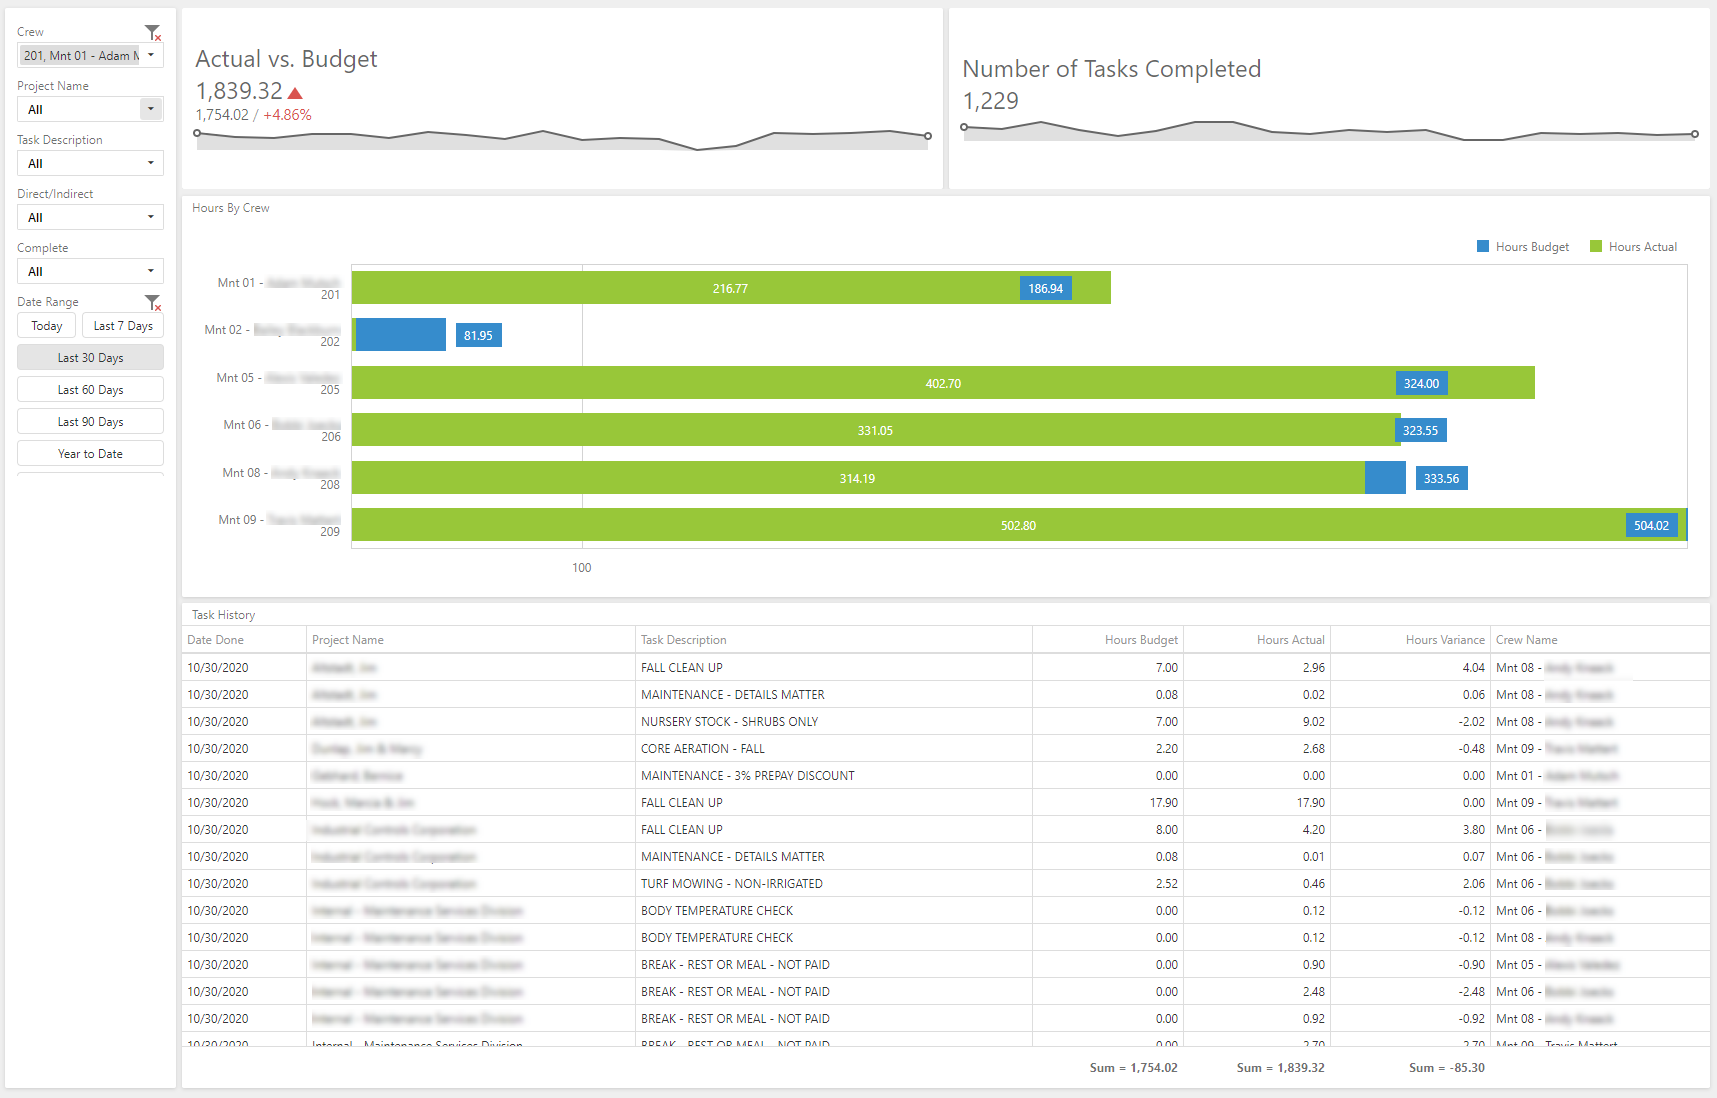
Having data at your fingertips can be a powerful tool—but only if you’re using it wisely. Include’s iKPI dashboard is a visual analysis tool that allows users to view data quickly and in an easy-to-read format.
But as Jensen Gardens in Omaha, Nebraska learned, the proper input of data is a key to success.
Steve Jensen, a retired insurance executive who has worked with data his entire career, says that it became apparent data input mistakes were making the dashboards inaccurate—the problem of “garbage in, garbage out.”
In other words, data errors will quickly negate any benefits of using the dashboard. While the data will be processed and easily visible through the dashboard, that doesn’t make the information accurate.
While it required a lot of effort in combing through the data and discovering where errors were commonly being made, Jensen says that fixing some of these input errors has allowed the data to be much more reliable.
“This process shined a light on what data was missing or wrong and allowed us to see how important it was to fix these errors so that we could rely on the dashboard,” Jensen says.
He shares more about how he was able to find and fix some of these mistakes.
Using the Dashboards to “Clean Data”
Jensen says that before you can rely on dashboards, you need to be sure that you’re putting in the correct data.
One way to do this is to use the dashboards to highlight where data problems exist in the first place.
For example, Jensen was able to use the Zero Revenue & Difference Report dashboard to discover and fix some of the company’s processing errors.
He sorted the dashboard using the “Difference” capability on all projects with the “Budget Revenue” higher than the “Actual Revenue” at the top (and the reverse to the bottom).
Then he looked for patterns.
In looking at 600 jobs, 200 were spot-on—the difference was zero. But the 400 that were not was a big deal.
“One of the problems we had was with general conditions,” he explains. “We were not putting that information incorrectly because we were wrapping other details into a bill like how much commissions were being paid and how much we spent on plant material.”
Another issue that came to light was sending jobs to production multiple times. Other errors included partial billing, jobs with no proposals, or jobs where items were billed but never sent to production.
“Landscape business owners might not be thinking to use their dashboards to highlight potential problems—but this has been really valuable in helping us to clean up our data,” Jensen says.
“We’re finding areas where that behind-the-scenes data was faulty and ultimately providing the wrong information. Even if it’s a small amount of money, it adds up over a large number of jobs.”
Jensen’s advice to other landscape business owners who are looking to use the iKPI dashboards to their advantage is to ensure you demonstrate buy-in from the upper level. But he says that will only come if everyone can be confident that data is accurate.
“A tool like iKPI is a lot of fun and it shows the data in a very visual way,” Jensen adds. “But the most important factor is that this data is correct.
Nobody will buy into using dashboards or even reports if they can’t trust what they’re seeing. So, before you dive into using dashboards, I would advise taking the time to find errors, fix your processes, and clean up your data.”